If you’re running Google Ads, one question comes up more than almost any other:
“What is a good CTR for Google Ads?”
Click-through rate (CTR) is often treated as a simple metric but after 15+ years managing Google Ads across multiple industries, I can confidently say this:
- CTR is contextual, not universal.
- A “good” CTR depends on campaign type, intent, industry, network, and goals.
In this in-depth guide, you’ll learn:
- What CTR actually means in Google Ads
- Average Google Ads CTR benchmarks (Search, Display, Shopping, Video)
- What’s considered a good, great, or poor CTR
- How Quality Score and CTR are connected
- When a high CTR is actually a bad sign
- Proven ways to improve CTR without hurting conversions
What Is CTR in Google Ads?
CTR (Click-Through Rate) measures how often people click your ad after seeing it.
CTR Formula:
CTR = (Clicks ÷ Impressions) × 100
Example:
- Impressions: 10,000
- Clicks: 350
CTR = 3.5%
This means 3.5% of users who saw your ad clicked it.
CTR is a core signal Google uses to understand ad relevance and expected engagement especially in Search campaigns.
Why CTR Matters in Google Ads
CTR isn’t just a vanity metric. It directly impacts:
1. Quality Score
Higher CTR → better Expected CTR → higher Quality Score
2. Cost Per Click (CPC)
Better Quality Score often leads to:
- Lower CPCs
- Higher ad rank at the same bid
3. Ad Visibility
Ads with strong CTRs are more likely to:
- Show in top positions
- Win more auctions
- Trigger more ad extensions
However CTR alone does not equal success (we’ll cover this later).
What Is a Good CTR for Google Ads? (2026 Benchmarks)
Below are realistic, experience-based CTR benchmarks used by top PPC professionals.
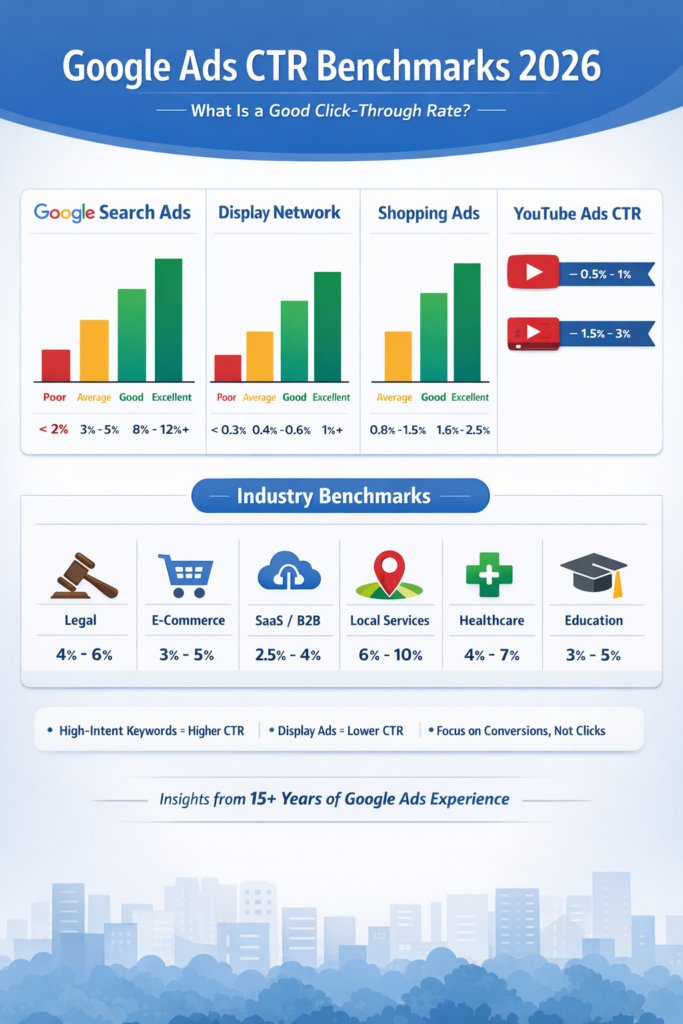
Google Search Ads CTR Benchmarks
| Performance Level | CTR Range |
|---|---|
| Poor CTR | Below 2% |
| Average CTR | 3% – 5% |
| Good CTR | 5% – 7% |
| Excellent CTR | 8% – 12%+ |
Expert Insight:
For high-intent keywords (brand, service + location, “buy”, “near me”), CTR above 7% is very achievable.
Google Display Network CTR Benchmarks
| Performance Level | CTR Range |
|---|---|
| Poor CTR | Below 0.3% |
| Average CTR | 0.35% – 0.6% |
| Good CTR | 0.7% – 1% |
| Excellent CTR | 1%+ |
Display CTRs are naturally lower because:
- Users are not actively searching
- Ads are interruption-based
Google Shopping Ads CTR Benchmarks
| Performance Level | CTR Range |
|---|---|
| Average CTR | 0.8% – 1.5% |
| Good CTR | 1.6% – 2.5% |
| Excellent CTR | 3%+ |
Shopping CTR heavily depends on:
- Product image quality
- Pricing competitiveness
- Brand trust
YouTube Ads CTR Benchmarks
| Ad Type | Good CTR |
|---|---|
| In-Stream Skippable | 0.5% – 1% |
| In-Feed Video Ads | 1.5% – 3% |
CTR Benchmarks by Industry (Search Ads)
Here’s a simplified industry view based on long-term account analysis:
| Industry | Good CTR |
|---|---|
| Legal Services | 4% – 6% |
| E-commerce | 3% – 5% |
| SaaS / B2B | 2.5% – 4% |
| Local Services | 6% – 10% |
| Healthcare | 4% – 7% |
| Education | 3% – 5% |
Local intent = higher CTR
Complex B2B = lower CTR
What Is Considered a Bad CTR in Google Ads?
A CTR may be considered poor if:
- Search CTR is below 2%
- Display CTR is below 0.3%
- High impressions but very few clicks
- CTR is declining month-over-month
Low CTR usually indicates:
- Poor keyword relevance
- Weak ad copy
- Wrong search intent
- Missing ad extensions
High CTR vs High Conversions: The Truth Most Don’t Tell You
Here’s a hard truth from real PPC experience:
A high CTR does NOT guarantee profitability.
When High CTR Is a Red Flag:
- Broad keywords driving curiosity clicks
- Misleading ad copy
- Clickbait offers
- Low-intent traffic
Example:
- CTR: 9%
- Conversion Rate: 0.3%
- Result: Money wasted
Always analyze CTR together with:
- Conversion rate
- Cost per conversion
- ROAS
- Lead quality
How CTR Impacts Quality Score
CTR is closely tied to Expected CTR, one of Google’s three Quality Score components:
- Expected CTR
- Ad relevance
- Landing page experience
Improving CTR can:
- Increase Quality Score
- Reduce CPC by 10–40%
- Improve impression share
But artificial CTR manipulation (misleading copy) will hurt long-term performance.
Proven Ways to Improve CTR in Google Ads (Without Killing Conversions)
1. Match Keyword Intent Precisely
Use:
- Exact & phrase match
- Strong negative keyword lists
Avoid vague keywords that attract curiosity clicks.
2. Write Benefit-Driven Headlines
Replace features with outcomes.
“CRM Software Platform”
“Close More Deals With Less Manual Work”
3. Use Numbers & Specifics
Ads with numbers consistently outperform.
Examples:
- “Get 30% Lower CPA”
- “Trusted by 15,000+ Businesses”
- “Same-Day Service”
4. Maximize Ad Extensions
Ad extensions increase CTR by 10–20% on average.
Use:
- Sitelinks
- Callouts
- Structured snippets
- Price extensions
- Location & call extensions
5. Align Ads With Landing Pages
Mismatch kills CTR and Quality Score.
Ad promise = landing page headline = offer.
6. Segment Campaigns Properly
Break campaigns by:
- Brand vs non-brand
- Location
- Device
- Match type
Granularity improves relevance → higher CTR.
CTR Benchmarks for Brand vs Non-Brand Keywords
| Keyword Type | Good CTR |
|---|---|
| Brand Keywords | 15% – 40% |
| Non-Brand Keywords | 3% – 6% |
| Competitor Keywords | 2% – 4% |
Never compare brand CTR with non-brand – it’s misleading.
What CTR Should You Actually Aim For?
Instead of chasing averages, ask:
- Is CTR improving over time?
- Is Quality Score increasing?
- Is CPC decreasing?
- Are conversions profitable?
A “good CTR” is one that supports your business goal not just looks good in reports.
Final Verdict: What Is a Good CTR for Google Ads?
Here’s the expert summary:
- Search Ads: 5%+ is good, 7%+ is excellent
- Display Ads: 0.6%+ is solid
- Shopping Ads: 1.5%+ is competitive
- Brand campaigns: 15%+ is normal
But remember:
CTR is a signal, not a success metric.
The real win is relevant clicks that convert profitably.