A Practical Guide for Search and Shopping Campaigns
Every advertisement shown on Google enters a live auction. In that auction, multiple advertisers compete for visibility based on relevance, bidding strategy, and overall ad quality. Most advertisers focus on their own performance metrics such as clicks, cost, and conversions. What often gets overlooked is how that performance compares with others competing in the same space.
Auction Insights exists to provide that missing context. It helps advertisers understand how often they appear in auctions, how frequently competitors appear alongside them, and who tends to win better positions. When used correctly, Auction Insights becomes a strategic tool for managing competition rather than a simple reporting feature.
What Auction Insights Is Designed to Show
Auction Insights offers a comparative view of auction performance. It does not reveal competitor budgets or bidding strategies. Instead, it shows how your visibility and positioning compare to other advertisers participating in the same auctions.
This distinction is important. Auction Insights is not about copying competitors. It is about understanding auction dynamics so you can make informed decisions about where to invest, where to defend, and where to reduce pressure.
Where Auction Insights Delivers the Most Value
Auction Insights can be viewed at campaign, ad group, keyword, or product group level. Its value increases as analysis becomes more focused.
For Search campaigns, Auction Insights is most useful for brand keywords, high intent non brand keywords, and competitive terms. For Shopping campaigns, it provides insight into product level competition, category visibility, and relative share of voice.
High level analysis helps identify trends. Deeper analysis reveals where action is required.
Impression Share and Visibility
Impression Share shows how often your ads appear compared to how often they are eligible to appear. It reflects visibility, but it also highlights missed opportunity.
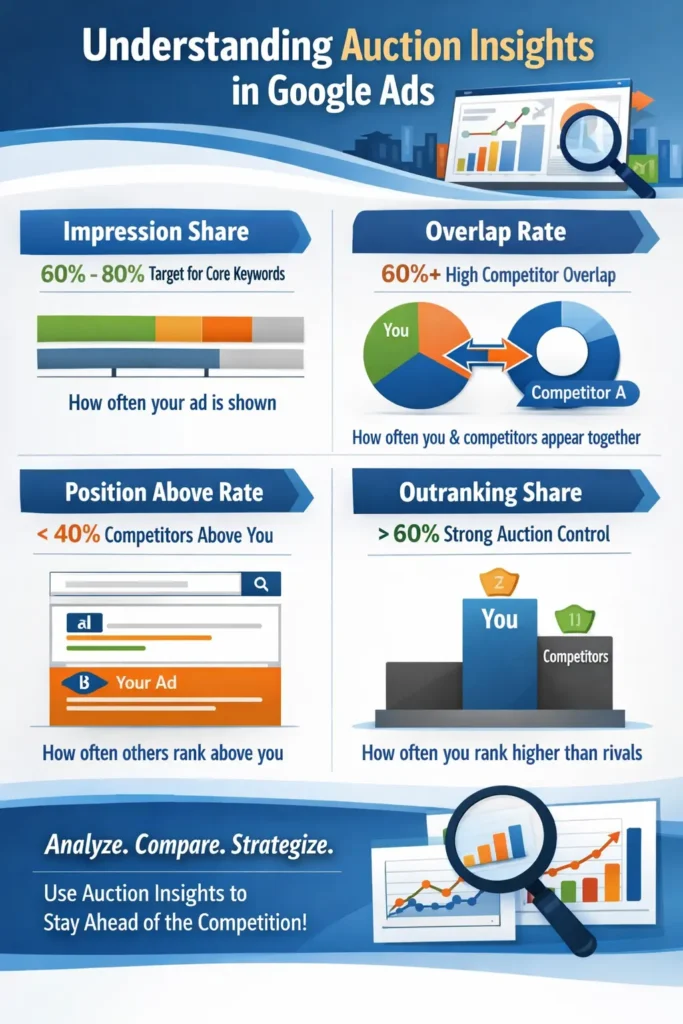
In well optimised Search campaigns, impression share commonly sits between sixty and eighty percent for core keywords. Brand campaigns often reach higher levels, while non brand campaigns may sit lower to control efficiency. When impression share drops below fifty percent on important keywords or product categories, it usually indicates budget limitations, low ad rank, or bidding constraints.
The goal is not maximum impression share. The goal is sufficient visibility where performance and profitability matter most.
Overlap Rate and Competitive Presence
Overlap Rate measures how often another advertiser appears in the same auctions as you. This metric helps identify who your real competitors are in practice, not just in theory.
A consistently high overlap rate, often above sixty percent, indicates direct competition on similar keywords or products. Moderate overlap suggests partial competition, while low overlap usually points to differences in targeting or bidding strategies.
Changes in overlap rate over time often signal shifts in competitor activity, such as budget increases or expansion into new areas.
Position Above Rate and Auction Pressure
Position Above Rate shows how often a competitor appears in a higher position than you when both ads are shown.
In many accounts, strong performance means competitors outrank you less than forty percent of the time on priority keywords. When a competitor appears above you more than sixty percent of the time, it usually reflects stronger ad relevance, higher expected click through rates, or better landing page experience rather than bidding alone.
This metric is most valuable as a quality and relevance indicator.
Top of Page and Absolute Top of Page Visibility
Top of Page Rate measures how often your ad appears above organic results. Absolute Top of Page Rate shows how often your ad appears in the first position.
For non brand Search campaigns, a top of page rate between sixty five and seventy five percent often represents a healthy balance between visibility and cost. Brand campaigns typically aim higher to protect demand and reinforce authority.
Absolute top position should be approached carefully. Many strong advertisers maintain absolute top coverage between forty and sixty percent on critical terms. Beyond that point, costs often increase faster than returns.
Outranking Share and Competitive Strength
Outranking Share measures how often your ad appears above a competitor or appears when the competitor does not.
This metric offers one of the clearest views of competitive strength. An outranking share above sixty percent against key competitors indicates strong control of the auction. A range between forty and sixty percent suggests balanced competition. Anything below forty percent indicates sustained pressure from competitors.
Tracking this metric over time helps identify rising threats before they impact performance results.
Auction Insights in Shopping Campaigns
In Shopping campaigns, Auction Insights provides insight at product and category level. It helps advertisers understand which products dominate auctions and which lose visibility.
Well structured Shopping campaigns often maintain impression share between fifty five and seventy percent for core categories. High margin or priority products may reach higher levels. When important products lose outranking share or top of page presence, the cause is often feed quality, bid structure, or increased competition.
Using Auction Insights alongside product segmentation allows advertisers to scale strong performers and control spend where competition becomes inefficient.
Using Auction Insights to Guide Strategy
Auction Insights is most effective when reviewed over consistent time periods such as fourteen or thirty days. This approach reveals meaningful trends rather than daily fluctuations.
If impression share declines while efficiency remains strong, additional budget or higher bids may unlock growth. If competitors gain visibility while costs rise, improving relevance and ad quality often produces better results than aggressive bidding.
The objective is not to win every auction. It is to win the auctions that matter most to the business.
Common Mistakes to Avoid
One common mistake is reacting too quickly to short term changes. Auction behavior varies daily and should be evaluated over time. Another mistake is prioritizing visibility metrics without considering profitability.
Auction Insights should support strategic decisions, not replace performance analysis. Its value increases when combined with conversion data and business objectives.
Auction Insights provides clarity in a competitive environment. It shows where you stand, how competition is evolving, and where strategic adjustments can protect or grow performance. Advertisers who use Auction Insights consistently gain better control over visibility, efficiency, and long term growth. It is not a report to glance at occasionally. It is a tool to guide informed, confident decisions across Search and Shopping campaigns.